Neural substrates of cold nociception in Drosophila larva
- Neuroscience Institute, Georgia State University, United States
- HHMI Janelia Research Campus, United States
- Department of Physiology, Development, and Neuroscience, University of Cambridge, United Kingdom
- MRC Laboratory of Molecular Biology, United Kingdom
- School of Life Sciences, Arizona State University, United States
Figures
Figure 1 with 7 supplements

CIII md neurons are primary cold sensors and share common post-synaptic partners with mechanosensory and nociceptive Ch and CIV md neurons.
(A) Sensory neuron second-order connectome analyses. Heatmap plot of synaptic connections between sensory neuron subtypes including chordotonal (Ch), class III (CIII) md, class IV (CIV) md neurons and previously published centrally located neurons. Sensory neurons (SN) Ch, CIII md, and CIV md were analyzed. Multisensory integrator (MSI) neurons include Basin-1, –2, –3, and –4. Neurons downstream of MSI (Post-MSI) include A00c, A05q, and Goro. Premotor neurons (PMNs) include Chair-1 (A10a), Down and Back (DnB), A02m, and A02n. Lastly, sensory neurons are also connected to several command/projection neurons including A02o, A09e, A10j, A09o, TePn04, and TePn05. Synaptic connectivity data was extracted from Neurophyla LMB Cambridge. (http://neurophyla.mrc-lmb.cam.ac.uk/). (B, C) Calcium imaging of sensory neurons including chordotonal (IAVGAL4), class III md (19–12 GAL4), and class IV md (ppkGAL4) neurons using CaMPARI2. There were three conditions for sensory neurons: No photoconversion (PC) control (no stimulus and no photoconversion), photoconversion control (photoconversion and no stimulus), and stimulus (Stim) condition (photoconversion and 6°C stimulus). CaMPARI2 data are reported area normalized intensity ratios for Fred/Fgreen (mean ± SEM). Average N for each cell type and each condition is n=32. (B) CaMPARI2 response measured at the cell body for each neuron type. (C) Sholl intensity analysis performed using custom FIJI scripts. CaMPARI2 response is measured radially away from the center of the soma. (D) Cold-evoked responses of third instar Drosophila larva. Sensory neurons Ch, CIII md or CIV md neurons were silenced by inhibiting neurotransmitter release via cell-type-specific expression of tetanus toxin (TNT). (D, left) Instantaneous %CT over time. The heatmap on top represents change in temperature over time. (D, right) Cumulative %CT response for a duration of 5s. Controls include w1118 and EmptyGAL4 >TNT. Significant stars: turquoise stars represent comparison to w1118 and purple stars represent comparison to EmptyGAL4 >TNT. Average n=72. (E) Neural activation of sensory neurons via cell-type-specific expression of ChETA relative to EmptyGAL4 >ChETA control. EmptyGAL4 n=35. Ch n=20, CIV n=20. & CIII n=143. (E, left) Instantaneous %CT over time. Blue bar represents optogenetic neural activation. (E, right) Peak %CT. (F) Neural co-activation of sensory neurons and CIII md neurons. Here each condition represents expression of ChETA in CIII md neurons and plus Ch (via IAV-GAL4), CIII (via R83B04GAL4) or CIV md neurons (via ppkGAL4). (F, left) Instantaneous %CT over time. Blue bar represents optogenetic neural activation. (F, right) Peak %CT response during optogenetic stimulation. CIII n=143 and average experimental n=50 Significant differences indicated via asterisks, where *p<0.05, ***p<0.001, and ****p<0.0001. (G, left) Cold-evoked CT behavioral responses throughout larval development. In controls (w1118), cold-evoked CT responses are stronger as the larvae develop. CT magnitude is significantly greater between 1st v. 3rd instars and 2nd v. 3rd instars. CT duration is significantly higher between 1st v. 3rd instars. Silencing CIII md (19–12 GAL4) using TNT leads to significantly reduced cold-evoked responses as measured via CT duration and magnitude across development when compared to age-matched w1118 controls. For each condition average n=82 larvae. (G, right) CIII md neuron activation via optogenetics reveals that CT responses increase as the animal develops. No ATR controls do not exhibit any CT responses as measured by CT duration and magnitude. Activating CIII md (19–12 GAL4) using ChR2-H134R leads to significantly increased optogenetic-evoked responses as measured via CT duration and magnitude across development when compared to age-matched no ATR controls. Drosophila larvae with ATR show significant increase in CT magnitude between 1st v. 3rd instars and 2nd v. 3rd instars. Additionally, CT duration is significantly higher between 1st v. 2nd instars and 1st v. 3rd instars. For each condition average n=27 larvae (H) Comparison between cold- and CIII-evoked CT responses throughout development, where the CT duration and magnitude are normalized to 1st instar larvae. (H, left) For 2nd instar larvae both cold- and CIII-evoked CT duration increases by ~20% compared to 1st instar larvae. For 3rd instar larvae both cold- and CIII-evoked CT duration increases by ~40% and~30%, respectively, compared to 1st instar larvae. (H, right) For 2nd instar larvae both cold- and CIII-evoked CT magnitude increases by ~13% and~10%, respectively, compared to 1st instar larvae. For 3rd instar larvae both cold- and CIII-evoked CT magnitude increases by ~32% compared to 1st instar larvae.
Figure 1—figure supplement 1

Sensory neuron connectivity matrix.
Synaptic connectivity matrix for neurons whose role in cold nociception was assessed. The number in brackets indicates the total number of neurons analyzed for each cell type. (A) Absolute number of synaptic connections between pre- and post-synaptic neurons. (B) Connectivity represented as proportion of synaptic input to the post-synaptic neurons.
Figure 1—figure supplement 2

Drosophila larval cold plate assay and quantitative analysis.
(A) A schematic of cold plate assay. Briefly, 3rd instar Drosophila larvae are plated on a thin metal plate, then we expose the larvae to noxious temperature by transferring the plate onto pre-chilled Peltier cold plate. (B) Behavior videos are automatically processed using custom macros in Fiji, where behavioral videos are cropped, and background is removed to improve quantitative analysis. (C) Larval surface area is measured using Noldus Ethovision. The following larval cold-evoked contraction (CT) behavioral metrics are calculated using r: Instantaneous CT%, cumulative CT%, CT duration and CT magnitude. We define CT behavioral response as a reduction in surface area less than –10%.
Figure 1—figure supplement 3

Stimulus-evoked calcium responses of Drosophila larval ventral nerve cord.
Representative images of Drosophila larval in vivo intact animal ventral nerve cord calcium responses assessed via pan-neural CaMPARI expression. Freely moving larvae were exposed to innocuous touch, noxious heat (45°C) or noxious cold (6°C) stimulus for 20s and simultaneously exposed to 20s of photo-converting light. Z-stacks of ventral nerve cord are shown with 2 µm steps. Briefly, all animals were from the same batch, imaging was conducted using the same settings, and larvae were exposed to the same levels of photo-converting light. For better visualization, Fred/Fgreen CaMPARI fluorescence is reported, and images were pseudo-colored for enhancing signal-to-noise ratio, where highest intensity represented as white and lowest intensity with dark blue. Scale bar represents 50 µm.
Figure 1—figure supplement 4

Somatosensory neural dendritic morphology and representative images of sensory neurons expressing CaMPARI2.
(A) Representative images of somatosensory neurons (Ch, CIII md, and CIV md). Note, all images have separate magnification. Each image’s scale bar represents 50 µm. Drosophila larva and larval brain graphic was created with BioRender.com. (B) Confocal images of chordotonal (Ch: IAVGAL4), class III md (CIII: 19-12GAL4), and class IV md (CIV: ppkGAL4) neurons expressing CaMPARI2. There were three conditions for sensory neurons: No photoconversion control (no stimulus [Stim] and no photoconversion [PC]), photoconversion control (photoconversion and no stimulus), and stimulus condition (photoconversion and 6°C stimulus). Top row shows merge of Fred and Fgreen, second row is Fgreen, third row is Fred, and last row contains FredLUT, which is pseudo-colored with highest intensity being white and lowest intensity being dark blue (color scale bar on bottom right). Cell body and dendrites are outlined in white for Ch, and cell body is outlined in white for CIII and CIV neurons. Scale bar represents 10 µm. (C) CIII md neurotransmitter release is required for cold-evoked mouth hook retraction in Drosophila larvae. Using epifluorescence microscopy, CIII md neuron cold-evoked increases in Ca2+ levels (19–12>GCaMP6 m±TNT) were assessed and the delay in mouth hook retraction was measured. Compared to controls, there is a significant delay in mouth retraction, when CIII md neurons are silenced with tetanus toxin expression. Average n=12 with three stimulations per animal.
Figure 1—figure supplement 5

Drosophila larval neural activation assays using optogenetics.
To perform neural activation experiments, we created a custom-built optogenetic experimental setup, which has a very high spatial resolution and signal-to-noise ratio by using principles of dark field illumination. (A) Schematic of custom optogenetic rig, where stimulus and video recording are controlled via computer using Noldus Ethovision. Individual Drosophila larva are plated on clear glass plate and illuminated from below with white light. Neuron activating blue light is also delivered from the below. Individual behavioral videos are automatically cropped and stabilized using custom Fiji macros. (B, C) We measured two variables: Drosophila larval surface area and mobility. (B) Top, image stills from various timepoints before and during optogenetic stimulation of cold-sensitive CIII md neurons resulting in contraction (CT) behavioral response. Bottom, percent change in area over time of an individual animal. During baseline, larval locomotion and turns results brief changes in surface area (±2–4%). Whereas upon neural stimulation, there is a distinct lasting reduction in surface area of less than –10%. (C) Larval mobility refers to changes in larval postures as measured by changes in occupied space. Since the amount of larval mobility is a function of various intrinsic and extrinsic factors, we normalized larval mobility to the baseline period, where there was no neural activation. Top, conceptual framework of how larval mobility is measured. Original videos are motion stabilized in the XY axis and thresholded. Next, we perform image calculations (Mobility=Frametimepoint 2 – Frametimepoint 1) to get just the red shaded portions denoting changes in postural locations (red arrowheads). Drosophila larval time series mobility data are reported as percent change in mobility, time spent being immobile and percent of immobile animals, or for a genotype percent of animals that are immobile over time, immobility is defined as –25% or more reduction in mobility.
Figure 1—figure supplement 6

Optogenetic activation of CIII md neurons.
(A) Activation of CIII md neurons using different optogenetic actuators including CsChrimson, ChETA, ChR2 and ChR2-H134R. Activation of CIII md neurons using either 19–12 GAL4 or 83B04GAL4 leads to a contraction response in third instar Drosophila larvae. Optogenetic activation of CIII md neurons (19–12 GAL4) using CsChrimson, ChETA, ChR2, or ChR2-H134R leads to CT responses. Each optogenetic actuator has unique impacts neuronal action potential firing rates leading to slightly different CT responses, however, CIII md neuron activation leads to CT behavioral response. (B–F) Represents instantaneous CT percentage responses of no ATR control and with ATR conditions for each of the actuators. (B–E) 470 nm light was used to activate CIII md neurons. (F) CsChrimson is very sensitive to minimal ambient white light exposure. Here, the experiments were conducted in near darkness conditions and thus no pre-stimulus data are recorded. The larval behavior was only recorded upon optogenetic light (617 nm) exposure. (B) 19–12GAL4>ChETA average n=27. (C) 19–12GAL4>ChR2 H134R average n=37. (D) 19–12GAL4>ChR2 average n=29. (E) 83B04GAL4>ChETA average n=30. (F) 19–12GAL4>CsChrimson average n=33.
Figure 1—figure supplement 7

Drosophila larval mobility pipeline and effects of neural activation and co-activation of sensory neurons on larval mobility.
(A–F) Drosophila larval mobility following somatosensory neuron optogenetic activation (A–C) and CIII md neuron plus co-activation of Ch, additional CIII GAL4 driver (83B04GAL4) or CIV md neurons (D–F). (A, D) Instantaneous percent immobility. Blue bar represents optogenetic neural activation. (B, E) Average percent change in mobility for each genotype, where greater percent immobility results in larger changes in average mobility. (C, F) Immobility duration in seconds during stimulation. Neural activation: EmptyGAL4’ n=35. Ch n=20, CIV n=20, and CIII n=143. Neural co-activation: CIII n=143 and average experimental n=50.Significant differences indicated via asterisks, where ****p<0.0001.
Figure 2 with 2 supplements

Multisensory integrator second order neurons are required for cold-evoked behaviors and facilitate CIII-evoked behaviors.
(A) Basins (1-4) receive inputs from sensory neurons (Ch, CIII md, and CIV md), Basins, premotor neuron Down and Back (DnB) and command-like/projection neuron A02o and TePn05. Heatmap plot of pre-synaptic connections to Basins. Synaptic connectivity data was extracted from Neurophyla LMB Cambridge. (http://neurophyla.mrc-lmb.cam.ac.uk/). (B–E) Cold-evoked responses of third instar Drosophila. Basin (1-4) neurons were silenced by inhibiting neurotransmitter release via cell-type-specific expression of tetanus toxin (TNT), where All Basin (R72F11GAL4), Basin-1 (R20B01GAL4), Basin-2 (SS00739splitGAL4), and Basin-4 (SS00740splitGAL4). (B) Instantaneous %CT over time. The heatmap on top represents change in temperature over time. (C) Cumulative %CT response for a duration of 5s. (D) CT duration in seconds. (E) CT magnitude as average percent change in area for the duration of stimulus. Controls include w1118, EmptyGAL4’ (w;;attP2) or EmptyGAL4’’>TNT (w;attP40;attP2). Significant differences were compared to each GAL4’s respective controls dependent on insertion sites. Significant stars: turquoise stars represent comparison to w1118, purple stars represent comparison to EmptyGAL4’>TNT and sea green stars represent comparison to EmptyGAL4’’>TNT. Average n=68. (F–I) Neural co-activation of Basin neurons and CIII md neurons. Here each condition represents expression of ChETA in CIII md neurons and plus Basin (1-4) neurons. (F) Instantaneous %CT over time. Blue bar represents optogenetic neural activation. (G) Peak %CT response during optogenetic stimulation. (H) CT duration in seconds during optogenetic stimulation. (I) CT magnitude as average percent change in area for the duration of stimulus. Significant stars: purple stars represent comparison to CIII md +EmptyGALGAL4’>ChETA. EmptyGAL4’ n=143 and experimental condition average n=49. (J) Overall percent change from control for either neural silencing or neural co-activation. The metrics for neural silencing include cumulative %CT, CT magnitude, and CT duration. The following metrics were used to calculate percent for neural co-activation: cumulative %CT, peak %CT, CT duration and magnitude. Significant differences indicated via asterisks, where *p<0.05, **p<0.01, ***p<0.001, and ****p<0.0001.
Figure 2—figure supplement 1

Neural reconstructions and larval mobility for multisensory integrator neurons.
(A) Individual Basin neuron subtypes (magenta) and CIII md neuron axons (blue). Neural reconstruction data was extracted from Neurophyla LMB Cambridge. (http://neurophyla.mrc-lmb.cam.ac.uk/). (B–D) Drosophila larval mobility for Basin plus CIII md neuron optogenetic co-activation. (B) Instantaneous percent immobility. Blue bar represents optogenetic neural activation. (C) Average percent change in mobility for each genotype, where greater percent immobility results in larger changes in average mobility. (D) Immobility duration in seconds during stimulation. EmptyGAL4’ n=143 and experimental condition n=49. Comparisons to CIII md +EmptyGALGAL4’>ChETA. Significant differences indicated via asterisks, where **p<0.01, and ****p<0.0001.
Figure 2—figure supplement 2

Optogenetic activation of individual neuronal cell types.
Heatmap represents optogenetically-evoked instantaneous contraction (CT) proportions of Drosophila larvae. Individual neuronal cell types were optogenetically activated using cell-type-specific expression of ChETA. Black arrow indicates optogenetic activation of primary cold somatosensory CIII md neurons, which are the only the genotype with high proportions CT. Average n=31.
Figure 3 with 1 supplement

Cold- and CIII-evoked calcium responses of Basin neurons.
(A–D) Ca2+ responses of Basin neurons upon cold exposure vs. controls (room temperature). Neural responses (CaMPARI2) of Basin neuron cell bodies were analyzed using the following cell type driver lines (A) All Basin (R72F11GAL4) average n=197, (B) Basin-1 (R20B01GAL4) average n=27, (C) Basin-2 (SS00739splitGAL4) average n=119 and (D) Basin-4 (SS00740splitGAL4) average n=46. CaMPARI2 fluorescence ratio is reported as Fred/Fgreen. We report the data as individual datapoints, where the red line represents mean, and hybrid plots (boxplot and violin) for visualizing the distribution and quartiles of data. Significant stars represent p<0.05, where comparisons were made to their respective no stimulus controls. (E–H) To functionally assess CIII md neuron to Basin-2 or Basin-4 connectivity, we optogenetically activated CIII md neurons (83B04lexA>CsChrimson) and visualized changes in evoked Ca2+ using Basin-2splitGAL4 or Basin-4splitGAL4>GCaMP6 m. Control: No all trans-retinal (ATR) supplemented diet, which is required for optogenetic stimulation in Drosophila. Orange bars indicate optogenetic stimulation. (E, G) Basin-2 and Basin-4 changes in GCaMP reported as ΔF/Fprestimulus, where prestimulus refers to 15s prior to optogenetic stimulation. (F, H) Maximum Basin-2 and Basin-4 neuronal responses (ΔF/Fprestimulus) upon optogenetic stimulation. Average n for each genotype was 13. Comparisons made to relevant controls and significant differences indicated via asterisks, where *p<0.05, **p<0.01, ***p<0.001, and ****p<0.0001.
Figure 3—figure supplement 1

Summary of behavioral and functional roles of multisensory integrators in cold nociception.
Blue arrows indicate strength of synaptic connectivity between the CIII md neurons and second order neurons. In the behavioral analysis column, the arrow direction indicates reduction or enhancement of CT response, and shading indicates the magnitude of change from control. In neural activity column: NC denotes no significant change in Ca2+ response, the arrow direction indicates reduction or enhancement in evoked Ca2+ response and shading indicates magnitude of change from control. Empty spaces indicate experimental analyses were not performed.
Figure 4 with 1 supplement

Projection neurons downstream of Basins and sensory neurons function in cold-evoked responses.
(A) A00c and A05q primarily receive inputs from Basins and premotor neuron Down and Back (DnB). Goro neurons primarily receive inputs from A05q neurons. Heatmap plot of pre-synaptic connections to downstream neurons. Synaptic connectivity data was extracted from Neurophyla LMB Cambridge. (http://neurophyla.mrc-lmb.cam.ac.uk/). (B–E) Cold-evoked responses of third instar Drosophila. We used cell-type-specific driver lines for downstream neurons to drive expression of tetanus toxin (TNT): A00c (R71A10GAL4), A05q (R47D0GAL4), and Goro (R69F06GAL4). (B) Instantaneous %CT over time. The heatmap on top represents change in temperature over time. (C) Cumulative %CT response for a duration of 5s. (D) CT duration in seconds. (E) CT magnitude as average percent change in area for the duration of stimulus. Controls include w1118 and EmptyGAL4’ (w;;attP2). For each genotype average n=64. Significant stars: turquoise stars represent comparison to w1118 and purple stars represent comparison to EmptyGAL4’>TNT. (F–I) Neural co-activation of downstream neurons and CIII md neurons. Here each condition represents the expression of ChETA in CIII md neurons plus A00c, A05q, or Goro neurons. (F) Instantaneous %CT over time. Blue bar represents optogenetic neural activation. (G) Peak %CT response during optogenetic stimulation. (H) CT duration in seconds during optogenetic stimulation. (I) CT magnitude as average percent change in area for the duration of stimulus. Significant purple stars represent comparison to CIII md + EmptyGAL4’>ChETA. EmptyGAL4 n=143 and experimental condition average n=33. (J) Overall percent change from control for either neural silencing or neural co-activation. The metrics for neural silencing include cumulative %CT, CT magnitude, and CT duration. The following metrics were used to calculate percent for neural co-activation: cumulative %CT, peak %CT, CT duration and magnitude. Significant differences indicated via asterisks, where *p<0.05, **p<0.01, and ***p<0.001.
Figure 4—figure supplement 1

Neural reconstructions and larval mobility for A00c, A05q, and Goro neurons.
(A) Individual interneuron subtypes (magenta) and CIII md neuron axons (blue). Neural reconstruction data was extracted from Neurophyla LMB Cambridge. (http://neurophyla.mrc-lmb.cam.ac.uk/). (B–D) Drosophila larval mobility for A00c, A05q, or Goro neurons plus CIII md neuron optogenetic coactivation. (B) Instantaneous percent immobility. Blue bar represents optogenetic neural activation. (C) Average percent change in mobility for each genotype, where greater percent immobility results in larger changes in average mobility. (D) Immobility duration in seconds during stimulation. Significant stars represent p<0.05, where stars represent comparison to CIII md +EmptyGALGAL4’>ChETA. EmptyGAL4 n=143 and experimental condition average n=33.
Figure 5 with 2 supplements

Premotor neurons downstream of sensory neurons and Basin neurons are required for cold-evoked responses.
(A) Chair-1 (A10a), A02m/n (predicted to be mCSI neurons) and Down and Back (DnB, A09l) primarily receive inputs from Basins, CIII md, and CIV md neurons. Heatmap plot of pre-synaptic connections to premotor neurons. Synaptic connectivity data was extracted from Neurophyla LMB Cambridge. (http://neurophyla.mrc-lmb.cam.ac.uk/). (B–E) Cold-evoked responses of third instar Drosophila. Premotor neurons were silenced by inhibiting neurotransmitter release via cell-type-specific expression of tetanus toxin (TNT), where Chair-1 (SS00911splitGAL4), DnB’ (IT4015GAL4), DnB’’ (IT412GAL4), and mCSI (R94B10GAL4). (B) Instantaneous %CT over time. The heatmap on top represents change in temperature over time. (C) Cumulative %CT response for a duration of 5s. (D) CT duration in seconds. (E) CT magnitude as average percent change in area for the duration of stimulus Controls include w1118, EmptyGAL4’ (w;;attP2), or EmptyGAL4’’>TNT (w;attP40;attP2). Significant differences were compared to each GAL4’s respective controls dependent on insertion sites. Significant stars: turquoise stars represent comparison to w1118, purple stars represent comparison to EmptyGAL4’>TNT and sea green stars represent comparison to EmptyGAL4’’>TNT. For each genotype average n=71. (F–I) Neural co-activation of premotor neurons and CIII md neurons. Here each condition represents expression of ChETA in CIII md neurons plus premotor neurons. (F) Instantaneous %CT over time. Blue bar represents optogenetic neural activation. (G) Peak %CT response during optogenetic stimulation. (H) CT duration in seconds during optogenetic stimulation. (I) CT magnitude as average percent change in area for the duration of stimulus. EmptyGAL4’ n=143 and experimental condition average n=35. Significant stars represent p<0.05, where purple stars represent comparison to CIII md +EmptyGALGAL4’>ChETA. (J) Overall percent change from control for either neural silencing or neural co-activation. The metrics for neural silencing include cumulative %CT, CT magnitude, and CT duration. The following metrics were used to calculate percent for neural co-activation: cumulative %CT, peak %CT, CT duration, and magnitude. Significant differences indicated via asterisks, where *p<0.05, **p<0.01, ***p<0.001, and ****p<0.0001.
Figure 5—figure supplement 1

Neural reconstructions and larval mobility for premotor neurons.
(A) Individual premotor neuron subtypes (magenta/green) and CIII md neuronal axons (blue). Neural reconstruction data was extracted from Neurophyla LMB Cambridge. (http://neurophyla.mrc-lmb.cam.ac.uk/). (B–D) Drosophila larval mobility observed with premotor neurons plus CIII md neuron optogenetic coactivation. (B) Instantaneous percent immobility. Blue bar represents optogenetic neural activation. (C) Average percent change in mobility for each genotype, where greater percent immobility results in larger changes in average mobility. (D) Immobility duration in seconds during stimulation. EmptyGAL4’ n=143 and experimental condition average n=35. Comparison to CIII md +EmptyGALGAL4’>ChETA. Significant differences indicated via asterisks, where *p<0.05, and ****p<0.0001.
Figure 5—figure supplement 2

Premotor network neurons are not required for cold-evoked responses.
(A–D) Cold-evoked responses of third instar Drosophila larvae. Premotor neurons were silenced by inhibiting neurotransmitter release via cell-type-specific expression of tetanus toxin (TNT), using these driver lines A01d3 (SS02065splitGAL4), A27k (SS026694splitGAL4), A02e (R70C01GAL4), A02f (SS01792GAL4), A02g (R36G02GAL4), and A31k (SS04399splitGAL4). (A) Instantaneous %CT over time. The heatmap on top represents change in temperature over time. (B) Cumulative %CT response for a duration of 5s. (C) CT duration in seconds. (D) CT magnitude is an average percent change in area for the duration of stimulus. Controls include w1118, EmptyGAL4’ (w;;attP2) or EmptyGAL4’’>TNT (w;attP40;attP2). Significant differences were compared to each GAL4’s respective controls dependent on insertion sites. There were no significant differences detected. Therefore, the following premotor neurons (A01d3, A27k, A02e, A02f, A02g, and A31k) are not required for cold-evoked CT responses. For each genotype average n=68.
Figure 6 with 1 supplement

Cold- and CIII-evoked calcium responses of premotor neurons.
(A–D) Ca2+ responses of premotor neurons upon cold exposure vs. controls (room temperature). Neural responses (CaMPARI2) of premotor neuron cell bodies were analyzed using the following cell type driver lines (A) mCSI (R94B10GAL4) average n=116, (B) Chair-1 (SS00911splitGAL4) average n=66, (C) DnB’ (IT4015GAL4) average n=250, and (D) DnB’’ (IT412GAL4) average n=245, CaMPARI2 fluorescence ratio is reported as Fred/Fgreen. We report the data as individual datapoints, where the red line represents mean, and hybrid plots (boxplot and violin) for visualizing the distribution and quartiles of data. Significant stars represent p<0.05, where comparisons were made to their respective no stimulus controls. (E–F) To functionally assess CIII md neuron to DnB connectivity, we optogenetically activated CIII md neurons (83B04lexA>CsChrimson) and visualized changes in evoked Ca2+ using DnB-GAL4 >GCaMP6 m. Control: No ATR supplemented diet, which is required for optogenetic stimulation in Drosophila. Orange bars indicate optogenetic stimulation. (E) DnB changes in GCaMP reported as ΔF/Fprestimulus, where prestimulus refers to 15s prior to optogenetic stimulation. (F) Maximum DnB neuronal responses (ΔF/Fprestimulus) upon optogenetic stimulation. Average n=10. Significant differences indicated via asterisks, where *p<0.05, **p<0.01, and ****p<0.0001.
Figure 6—figure supplement 1

Summary of behavioral and functional roles of premotor neurons in cold nociception.
Blue arrows indicate strength of synaptic connectivity between the CIII md neurons and second order neurons. In the behavioral analysis column, the arrow direction indicates reduction or enhancement of CT response, and shading indicates the magnitude of change from control. In the neural activity column: NC denotes no significant change in Ca2+ response, the arrow direction indicates reduction or enhancement in evoked Ca2+ response, and shading indicates the magnitude of change from control. Empty spaces indicate experimental analyses were not performed.
Figure 7 with 2 supplements

Projection neurons downstream of CIII md neurons are required for cold-evoked responses.
(A) A09e, A09o, A10j, TePn04, TePn05, A08n, dILP7, and A02o primarily receive inputs from CIII md, CIV md, Basin-1, Basin-2, and DnB neurons. Heatmap plot of pre-synaptic connections to projection neurons. Synaptic connectivity data was extracted from Neurophyla LMB Cambridge. (http://neurophyla.mrc-lmb.cam.ac.uk/). (B–E) Cold-evoked responses of third instar Drosophila. Projection neurons were silenced by inhibiting neurotransmitter release via cell-type-specific expression of tetanus toxin (TNT), where A09e (SS00878splitGAL4), R61A01GAL4 (labels A09o, A10j, TePn04, and TePn05), and A08n (R82E12GAL4). (B) Instantaneous %CT over time. The heatmap on top represents change in temperature over time. (C) Cumulative %CT response for a duration of 5s. (D) CT duration in seconds. (E) CT magnitude as average percent change in area for the duration of stimulus. Controls include w1118, EmptyGAL4’ (w;;attP2) or EmptyGAL4’’>TNT (w;attP40;attP2). Significant differences were compared to each GAL4’s respective controls dependent on insertion sites. Significant stars: turquoise stars represent comparison to w1118, purple stars represent comparison to EmptyGAL4’>TNT and sea green stars represent comparison to EmptyGAL4’’>TNT. For each genotype average n=72. (F–I) Neural co-activation of projection neurons and CIII md neurons. Here, each condition represents the expression of ChETA in CIII md neurons plus projection neurons. (F) Instantaneous %CT over time. Blue bar represents optogenetic neural activation. (G) Peak %CT response during optogenetic stimulation. (H) CT duration in seconds during optogenetic stimulation. (I) CT magnitude as average percent change in area for the duration of stimulus. EmptyGAL4’ n=143 and experimental condition average n=35. Significant purple stars represent comparison to CIII md +EmptyGALGAL4’>ChETA. (J) Overall percent change from control for either neural silencing or neural co-activation. The metrics for neural silencing include cumulative %CT, CT magnitude, and CT duration. The following metrics were used to calculate percent for neural co-activation: cumulative %CT, peak %CT, CT duration, and magnitude. Significant differences indicated via asterisks, where *p<0.05, **p<0.01, and ***p<0.001.
Figure 7—figure supplement 1
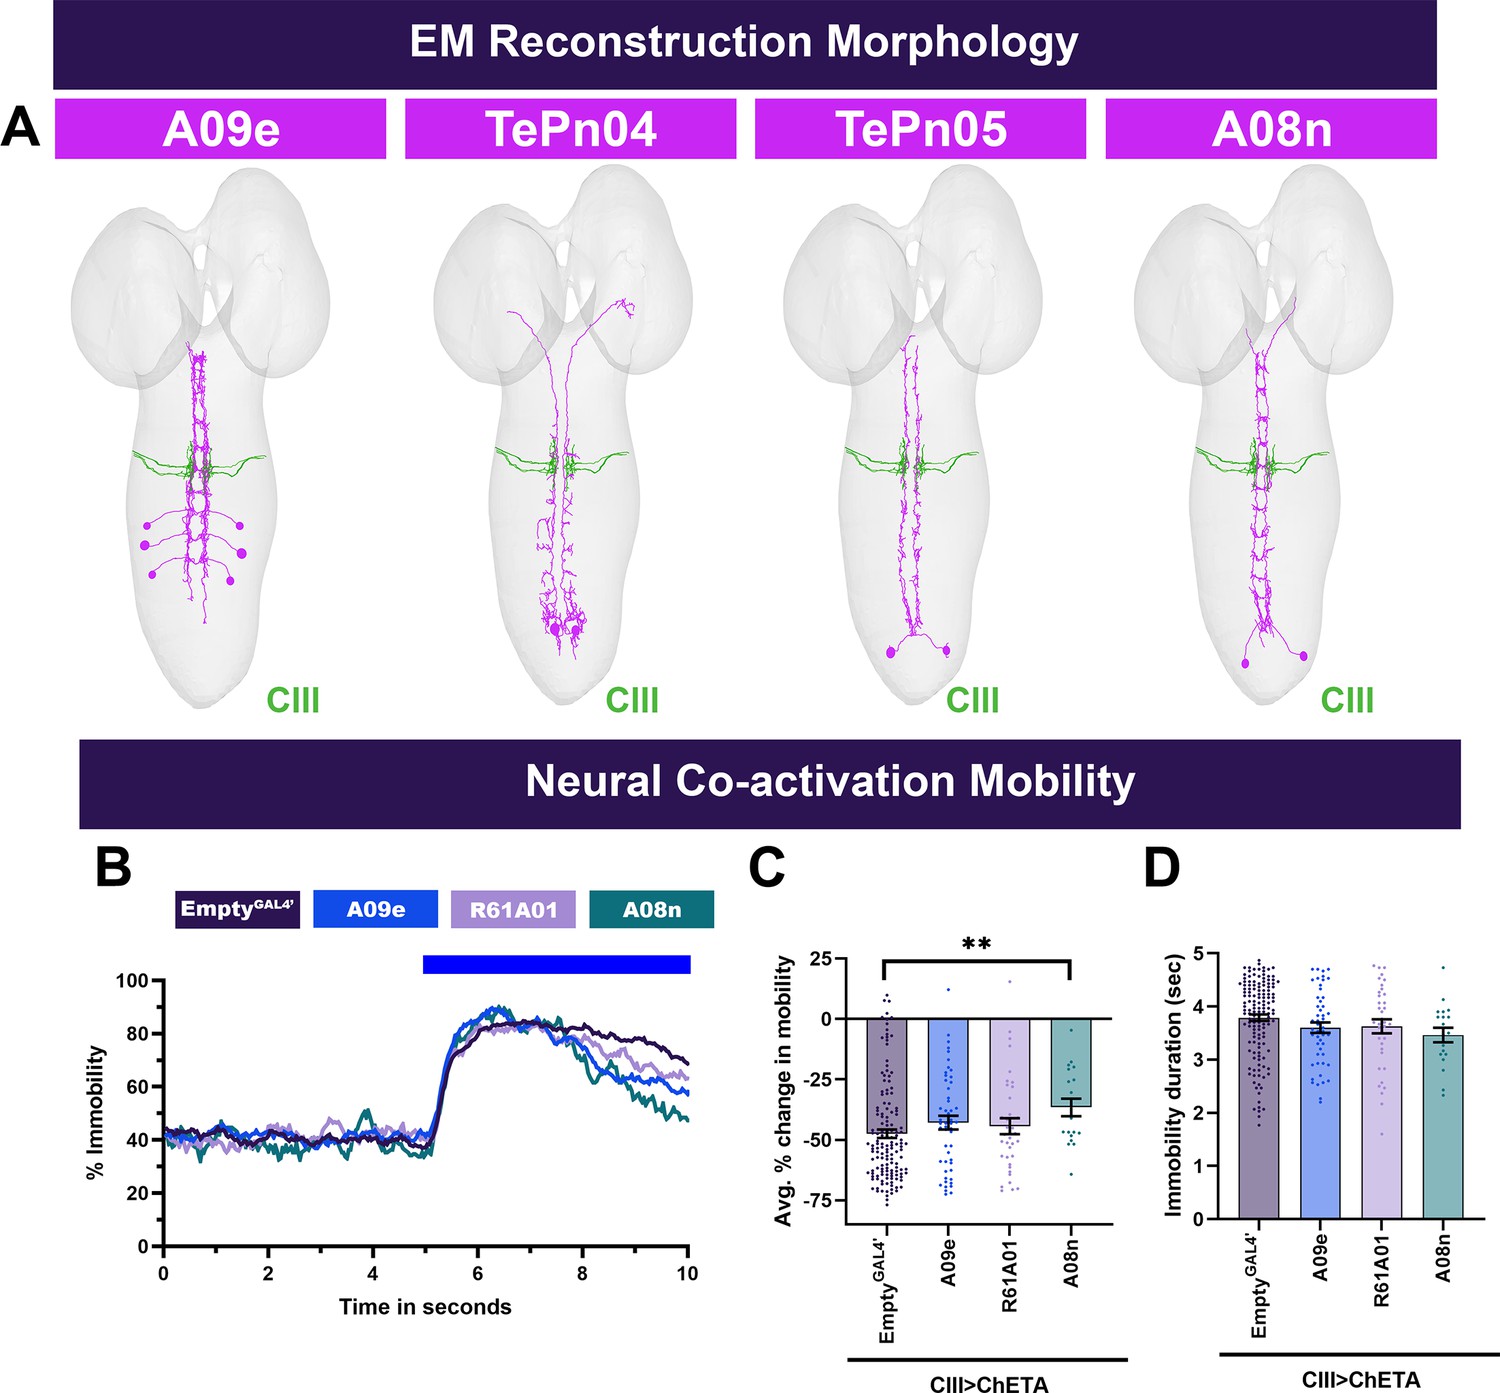
Neural reconstructions and larval mobility for projection neurons.
(A) Individual projection neuron subtypes (magenta) and CIII md neuron axons (blue). Neural reconstruction data was extracted from Neurophyla LMB Cambridge. (http://neurophyla.mrc-lmb.cam.ac.uk/). (B–D) Drosophila larval mobility observed with projection neurons plus CIII md neuron optogenetic coactivation. (B) Instantaneous percent immobility. Blue bar represents optogenetic neural activation. (C) Average percent change in mobility for each genotype, where greater percent immobility results in larger changes in average mobility. (D) Immobility duration in seconds during stimulation. Significant stars represent p<0.05, where stars represent comparison to CIII md +EmptyGALGAL4’>ChETA. EmptyGAL4’ n=143 and experimental condition average n=35. Significant differences indicated via asterisks, where **p<0.01.
Figure 7—figure supplement 2

dLIP7 and A02o neuronal roles in cold nociception.
(A–D) Cold-evoked responses of third instar Drosophila. Projection neurons were silenced by inhibiting neurotransmitter release via cell-type-specific expression of tetanus toxin (TNT) using driver lines for dILP7 (ILP7GAL4) and A02o (MB120bsplitGAL4). (B) Instantaneous %CT over time. The heatmap on top represents change in temperature over time. (C) Cumulative %CT response for a duration of 5s. (D) CT duration in seconds. (E) CT magnitude as average percent change in area for the duration of stimulus. Controls include w1118, EmptyGAL4’ (w;;attP2) or EmptyGAL4’’>TNT (w;attP40;attP2). Significant differences were compared to each GAL4’s respective controls dependent on insertion sites. For each genotype average n=73. Significant differences indicated via asterisks, where *p<0.05 and **p<0.01.
Figure 8 with 1 supplement

Cold- and CIII-evoked calcium responses of projection neurons.
Neural responses of A09e (SS00878GAL4) (A-C) and terminally located TePns (−04,–05) were analyzed using R61A01GAL4 (D-F). (A, D) Ca2+ responses of projection neurons upon cold exposure vs. controls (room temperature). Cold-evoked neural responses (CaMPARI2) of projection neuron cell bodies were analyzed for (A) A09e (n=27) and (D) TePns04, and TePn05 (n=42). CaMPARI2 fluorescence ratio is reported as Fred/Fgreen. We report the data as individual datapoints, where the red line represents mean, and hybrid plots (boxplot and violin) for visualizing the distribution and quartiles of data. Significant stars represent p<0.05, where comparisons were made to their respective no stimulus controls. (B, C, E-F) To assess, if A09e or TePns functions downstream of CIII md neurons, we optogenetically activated CIII md neurons (83B04lexA>CsChrimson) and visualized changes in evoked Ca2+ using projection neuron-specific GAL4>GCaMP6 m. Control: No ATR supplemented diet, which is required for optogenetic stimulation in Drosophila. Orange bars indicate optogenetic stimulation. (B, E) Changes in GCaMP reported as ΔF/Fprestimulus, where prestimulus refers to 15s prior to optogenetic stimulation. (C, F) Maximum neuronal responses (ΔF/Fprestimulus) upon optogenetic stimulation. A09e average n=22. TePns average n=8. Significant differences indicated via asterisks, where *p<0.05, ***p<0.001, and ****p<0.0001.
Figure 8—figure supplement 1

Summary of behavioral and functional roles of projection neurons in cold nociception.
Blue arrows indicate the strength of synaptic connectivity between the CIII md neurons and second-order neurons. In the behavioral analysis column, the arrow direction indicates reduction or enhancement of CT response, and shading indicates the magnitude of change from control. In neural activity column: NC denotes no significant change in Ca2+ response, the arrow direction indicates reduction or enhancement in evoked Ca2+ response, and shading indicates the magnitude of change from control. Empty spaces indicate experimental analyses were not performed.
Figure 9

Dimensional reduction analysis of Drosophila larval behavioral responses and synaptic connectivity informs functional connectivity assessed via Ca2+ imaging.
(A, B) Instantaneous CT proportions for all genotypes in this study. (A) Neural co-activation experiments, where CIII plus additional neuronal types were simultaneously optogenetically activated. Controls for optogenetic experiments were tested with or without ATR supplement and include the following conditions: background strain (w1118), background strain crossed to UAS-ChETA, and EmptyGAL4 crossed to UAS-ChETA. Blue bar represents optogenetic stimulation. (B) Neurotransmitter release inhibition of individual neuronal types using cell-type-specific expression of TnT. (C, D) t-distributed stochastic neighbor embedding (t-SNE) analysis of all neuronal subtypes role in both cold nociception (neural silencing data) and CIII md neuron-evoked CT facilitation (co-activation data). (C) 2D plot of t-SNE analysis, where post-hoc clustering analysis based on ‘Euclidian complete’ method revealed five unique groups. The following percent change from control (EmptyGAL4) data were included in the analysis: For neural co-activation (peak % CT response, cumulative % CT response, average % change in area, and CT duration) and for neural silencing (cumulative % CT response, average % change in area, and CT duration). (D) Average percent change from control for each cluster in (C) across all neural co-activation or neural silencing metrics. (E) Synaptic connectivity informs cold-evoked behavioral responses. Here, for each neuron type, the percent synaptic input from CIII md neurons is plotted against cold-evoked CT % upon neuron silencing. There is a negative correlation between greater synaptic connectivity and lower % CT response. (F–H) Analyses of connectivity upon select circuit components and comparative CIII md neuron-evoked calcium responses in post-synaptic neurons. (F) Proportion of synaptic inputs amongst neurons are plotted. A09e neurons integrate responses from multiple pathways originating from CIII md neurons. Network map created using Cytoscape (Shannon et al., 2003). (G, H) CIII md neuron-evoked calcium responses in post-synaptic neurons. (G) ΔF/Fbaseline over time. (H) Average max ΔF/Fbaseline. Averages ± SEM of all trials are plotted. Significant differences indicated via asterisks, where *p<0.05, **p<0.001, and ****p<0.0001.
Figure 10 with 1 supplement

Muscular basis of Drosophila larval cold-evoked CT at segmental and individual muscle level.
(A) Motor neurons (MN) receiving synaptic input from premotor neurons that are downstream of CIII md neurons. Heatmap plot of pre-synaptic connections to motor neurons. Synaptic connectivity data was extracted from Neurophyla LMB Cambridge. (http://neurophyla.mrc-lmb.cam.ac.uk/). (B–D) Analysis of cold-evoked Ca2+ responses of muscles in individual segments measured by expressing jRCaMP1a using Mef2GAL4. Larval graphic created using BioRender.com. (B) Average ΔF/Fprestimulus of individual larval segments across time. (B’) Average cold-evoked Ca2+ response in the anterior (T1–A1), central (A2–A5), posterior (A6–A8) segments. Dotted lines mark max ΔF/Fprestimulus and time to max ΔF/Fprestimulus. (C) Average ΔF/Fprestimulus of individual larval segments during cold exposure. (D) Individual larval average ΔF/Fprestimulus for each larval segments during cold exposure. Individual larval responses exhibit a variety of cold-evoked increases in Ca2+, similar to the range of observed micro-behaviors that lead to CT. Average n=16. (E–H) Analysis of cold-evoked Ca2+ of individual muscle cells in Drosophila larvae as measured by expressing jRCaMP1a using Mef2GAL4 and laser confocal microscopy. (E) Schematic of individual muscle cells in a larval hemi-segment from an external view. Muscles that are numerically labeled were analyzed; many ventrally located muscles could not reliably be analyzed. (F) Average ΔF/Fprestimulus of individual spatial muscle groups as defined in Zarin et al., 2019. All muscle groups show cold-evoked Ca2+ increase; however, the dynamics of each muscle group are varied. Dorsal longitudinal (DL) and Dorsal oblique (DO) both have strong cold-evoked Ca2+ response that is largely stable throughout the stimulus period. Both DL and DO muscles have a peak average ΔF/ Fprestimulus about halfway through the stimulus. Lateral Transverse (LT) muscles show an ever-increasing cold-evoked Ca2+ response that peaks near the end of the stimulus. Lastly, Ventral Longitudinal (VL) and Ventral Oblique (VO) have cold-evoked Ca2+ increase that is highest at the onset of stimulus and decays gradually throughout the stimulus period. (G) Cold-evoked average ΔF/Fprestimulus of individual muscles across time. (H) Cold-evoked average max ΔF/Fprestimulus of individual muscles across time. Average n=16. (I) Heatmap representation of average time max ΔF/Fprestimulus for individual muscles.
Figure 10—figure supplement 1

Motor neuron silencing or pharmacological anesthesia results in significant reductions in cold-evoked muscle activity.
(A–E) Cold-evoked muscle Ca2+ responses with functional motor neurons and optogenetically silenced motor neurons. (A, B) Heatmap of average ΔF/Fprestimulus GCaMP6f responses in segments T1-A4. Segments A5-A8 were not analyzed due to high autofluorescence of the digestive tract. (C, D) Heatmap of average ΔF/Fprestimulus GCaMP6f responses individual larvae and segments during the stimulus period. When motor neurons are silenced, nearly all analyzed segments have similar cold-evoked responses compared to controls, with certain segments reaching very high average ΔF/Fprestimulus. (E) Average muscle average ΔF/Fprestimulus GCaMP6f response comparison for each segment between control and silenced motor neurons. Average n=13 larvae. Genotype: 44H10-GCaMP6f, D42 >GtACR1±ATR. (F–H) Muscle postsynaptic density (PSD) Ca2+ responses were assessed using SynapGCaMP6f (MHC-CD8-GCaMP6f-Sh) in Drosophila larval segment T3/A1. In controls, there is a robust cold-evoked increase in Ca2+ levels; however, upon ethyl ether application, there is a significant reduction in evoked Ca2+ levels. (F) Average ΔF/Fprestimulus over time for all stimulations. (G) Average ΔF/Fprestimulus during stimulus of all quantified PSDs for each animal across three stimulations. (H) Average ΔF/Fprestimulus of individual PSDs across three stimulations. Average n=3 larvae with average PSDs n=171.
Author response image 1

(A) For optogenetic experiments, percent turning was assessed in control conditions and sensory neuron activation. Only CIV md neurons activation results in an increase in bending response. Other conditions do not blue light-evoked turning. (A’) We assessed larval turning based on ellipse fitting using FIJI, the aspect ratio of the radii is indicative of larval bending state. We empirically determined that radii ratio of <2.5 represents a larval turning/bending. This method of ellipse fitting has previously been used to identify C. elegans postures using WrMTrck in FIJI (Nussbaum-Krammer et al., 2015). (B) Percent immobility for all control conditions plus sensory activation driver lines. Only CIII md neuron activation leads to sustained stimulus-locked increase in immobility. There’s also no blue light-evoked reductions in mobility, indicating that there was not increase in larval movement due to blue light. (C) We assessed CIII md (ddaF) and CIV md (ddaC) neurons response to blue light with similar light intensity that was used in behavioral optogenetic experiments. There is no blue light evoked increase in RCaMP fluorescence.
Tables
Table 1
Drosophila melanogaster strains used in this study.
| Designation | Nomenclature | Source or reference | Identifier | Insertion site |
|---|---|---|---|---|
| w1118 | BDSC | 3605 | ||
| CaMPARI2 | UAS-CaMPARI2 | BDSC | 78317 | attP5 |
| ChETA | UAS-ChETA::YFP | BDSC | 36495 | attP2 |
| ChR2 | UAS-ChR2 | BDSC | 9681 | Chr 3 |
| ChR2-H134R | UAS-H134R-ChR2 | BDSC | 28995 | Chr 2 |
| CsChrimson | LexAop2-CsChrimson.tdTomato | BDSC | 82183 | VK00005 |
| CsChrimson | UAS-IVS-CsChrimson.mCherry | BDSC | 82180 | VK00005 |
| GCaMP6m | UAS-GCaMP6m | BDSC | 42748 | attP40 |
| Pan-neural CaMPARI | R57C10GAL4, UAS-CaMPARI | BDSC | 58763 | VK00040/VK00020 |
| RCaMP | UAS-jRCaMP1a | BDSC | 63792 | VK00005 |
| SynapGCaMP6f | Mhc-SynapGCaMP6f | BDSC | 67739 | Chr 3 |
| Muscle GCaMP +GtACR1 | w;;44H10::GCaMP6f, UAS-GtACR1 | Gift from Zarin Lab | ||
| TnT | UAS-TeTxLC.tnt-E2 | BDSC | 28837 | Chr 2 |
| Ch | IAV - GAL4 | BDSC | 52273 | Chr 3 |
| CIII | 19–12 - GAL4 | Chr 3 | ||
| CIII | R83B04 - GAL4 | BDSC | 41309 | attP2 |
| CIII | R83B04 - lexA | This Study | ||
| CIII >ChETA | 19–12GAL4, UAS-ChETA::YFP | BDSC | 36495 | Chr 3,attP2 |
| CIV | ppk - GAL4 | BDSC | 32079 | Chr 3 |
| Mef2 | Mef2-GAL4 | BDSC | 27390 | Chr 3 |
| EmptyGAL4’ | w;;attP2 | BDSC | 68384 | attP2 |
| EmptyGAL4’’ | w;attP40;attP2 | Gift from Rubin Lab | attP40;attP2 | |
| A00c | R71A10 - GAL4 | BDSC | 39562 | attP2 |
| A01d3 | SS02065 - splitGAL4 | Gift from Nose Lab | attP40;attP2 | |
| A02e | R70C01 - GAL4 | BDSC | 39520 | attP2 |
| A02f | SS01792 - GAL4 | Gift from Zlatic & Ohyama Labs | attP40;attP2 | |
| A02g | R36G02 - GAL4 | BDSC | 49939 | attP2 |
| A02o | MB120B - splitGAL4 | Gift from Nose Lab | attP40;attP2 | |
| A05q | R47D07 - GAL4 | BDSC | 50304 | attP2 |
| A08n | R82E12 - GAL4 | BDSC | 40153 | attP2 |
| A09e | SS00878 - splitGAL4 | Gift from Zlatic Lab | attP40;attP2 | |
| A27k | SS026694 - splitGAL4 | Gift from Nose Lab | attP40;attP2 | |
| A31k | SS04399 - splitGAL4 | Gift from Zarin Lab | attP40;attP2 | |
| All Basin | R72F11 - GAL4 | BDSC | 39786 | attP2 |
| Basin-1 | R20B01 - GAL4 | BDSC | 48877 | attP2 |
| Basin-2 | SS00739 - splitGAL4 | Gift from Zlatic Lab | attP40;attP2 | |
| Basin-4 | SS00740 - splitGAL4 | Gift from Zlatic Lab | attP40;attP2 | |
| Chair-1 | SS00911 - splitGAL4 | Gift from Zlatic Lab | attP40;attP2 | |
| dILP7 | ILP7 – GAL4 | Gift from Jan Lab | ||
| DnB' | IT4051 - GAL4 | Gift from Grueber Lab | Chr 3 | |
| DnB'' | IT412 - GAL4 | BDSC | 63300 | Chr 3 |
| Goro | R69F06 - GAL4 | BDSC | 39497 | attP2 |
| mCSI | R94B10 - GAL4 | BDSC | 41325 | attP2 |
| R61A01/TePns | R61A01 - GAL4 | BDSC | 39269 | attP2 |
| D42 | D42 – GAL4 | BDSC | 8816 | Chr 3 |
Additional files
Download links
A two-part list of links to download the article, or parts of the article, in various formats.
Downloads (link to download the article as PDF)
Open citations (links to open the citations from this article in various online reference manager services)
Cite this article (links to download the citations from this article in formats compatible with various reference manager tools)
Neural substrates of cold nociception in Drosophila larva
eLife 12:RP91582.
http://doi.org/10.7554/eLife.91582.3


