This is documentation for the next version of Grafana documentation. For the latest stable release, go to the latest version.
DocumentationGrafana documentationWhat's newWhat's new in Grafana v12.1
Grafana Cloud
Enterprise
Open source
What’s new in Grafana v12.1
It’s 12.1 time! We’re really excited about GA for a new alert rule page that makes it easier to find what you need quickly, as well as the regression analysis transformation, helping you predict future data values or estimate missing data points that might not be exactly represented in the original dataset. Also, visualization actions now support custom variables. When triggered, actions prompt you to input whatever custom variable was defined, allowing you to tailor requests in real time without modifying dashboard configuration. This is super helpful for when you’re triggering alerts, filtering API calls, or sending user-defined parameters to external systems. And you can try out Grafana Advisor, which automatically detects plugin, data source, and SSO issues, keeping your Grafana instance healthy and secure.
Speaking of security, Grafana now supports Entra Workload Identity, simplifying OAuth and increasing security for instances using Microsoft Azure. Thanks to community contributor mehighlow for this feature!
We have one more community contributor to thank for this release. Chris Hodges delivered server-configurable quick time ranges for dashboards. Now you can define custom time range presets for the time picker on dashboards, perfect for teams that routinely analyze specific, context-driven time windows.
Keep reading to learn about what else we have in store for 12.1.
For even more detail about all the changes in this release, refer to the changelog. For the specific steps we recommend when you upgrade to v12.1, check out our
Upgrade Guide.
Data sources
LogicMonitor Enterprise data source for Grafana
Grafana CloudGenerally AvailableEnterpriseAvailable in public preview
Data sourcesPlugins
Introducing LogicMonitor data source plugin.
The LogicMonitor Devices data source plugin enables you to query and visualize Device Instance Data, and to list Devices, Datasources, and Instances directly within Grafana. Available in public preview in Grafana Cloud and all supported versions of self-managed Grafana Enterprise.
Read more
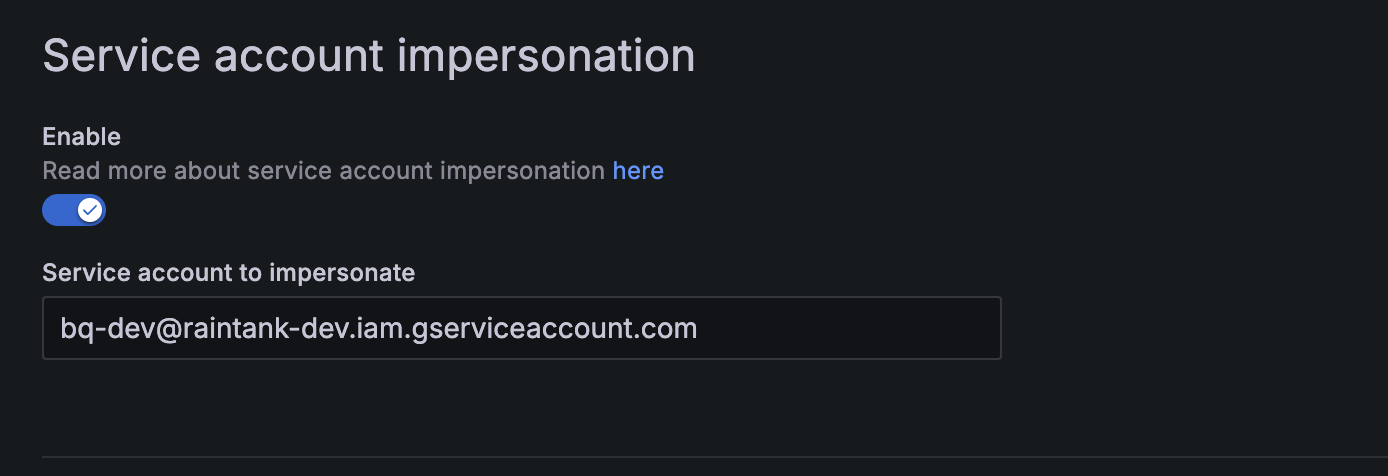
Support for Service Account Impersonation in BigQuery
Grafana CloudGenerally AvailableOpen sourceGenerally Available
Data sources
For better security, Google advises using Service Account Tokens with Service Account Impersonation. If a Service Account Token is ever compromised, it can’t be used to access Google Cloud APIs without the associated service account for impersonation, making it much harder for unauthorized access. This added security layer is now supported in the BigQuery data source configuration.
Read more
Keep instances running smoothly with Grafana Advisor
Grafana CloudAvailable in public previewOpen sourceEnterpriseAvailable in public preview
Plugins
The Grafana Advisor is designed to help Grafana server administrators keep their instances running smoothly, securely and in keeping with best practices.
It performs a series of periodic checks against your Grafana instance to highlight issues requiring the server administrator’s attention.
Read more
Alerting
Alert rule list page updates
Grafana CloudGenerally AvailableEnterpriseGenerally Available
Alerting
The alert rule page has received a total redesign. The new page features a smoother, faster, and more flexible design to help make your alert rule management easier.
Read more
Active time intervals in Grafana Alerting
Grafana CloudGenerally AvailableOpen sourceEnterpriseGenerally Available
Alerting
Mute Timings have been renamed to Active Time Intervals to better align with their usage.
Add ability to import rules to GMA from Prometheus YAML
Grafana CloudGenerally AvailableOpen sourceEnterpriseGenerally Available
Alerting
We recently added support for importing data source-managed rules through the alerting UI. However, users couldn’t import their existing Prometheus rules when no ruler was available.
Read more
Dashboards and visualizations
Spot patterns in your data with the Trendline transformation
Grafana CloudGenerally AvailableOpen sourceEnterpriseGenerally Available
Dashboards and visualizations
Apply this transformation to any dataset to add a trendline as a new series, fitted to your data using linear regression. This allows you to infer what the data was at a point that may not be exactly represented in the original dataset, or plot predicted values in the future. Trendlines are great for spotting patterns in fluctuating or inconsistent time series. This transformation is extra useful because trendlines can be styled and used just like any other series in your visualization. The Trendline transformation supports both linear and polynomial regression models.
Grafana CloudGenerally AvailableOpen sourceEnterpriseGenerally Available
Dashboards and visualizations
We’re excited to announce that you can now define custom variables within visualization actions. When you trigger an action (such as an API request), you’ll be prompted to provide input for those variables. This makes actions more dynamic and interactive, allowing you to tailor requests in real time without modifying the dashboard configuration.
Read more
Server-configurable quick time ranges for dashboards
Open sourceEnterpriseGenerally Available
Dashboards and visualizations
Grafana server administrators can now define custom time range presets for the time picker on dashboards — perfect for teams that routinely analyze specific, context-driven time windows.
Grafana CloudGenerally AvailableOpen sourceEnterpriseGenerally Available
Dashboards and visualizations
Previously, Grafana automatically abbreviated large currency values like $1,235,667 to $1.24M or $555,558 into $555.6K. While this works well for most visualizations, financial data often requires exact values to be displayed.
Read more
Authentication and authorization
Entra Workload Identity Support
Grafana CloudGenerally AvailableOpen sourceEnterpriseGenerally Available
Authentication and authorization
Grafana now supports Entra Workload Identity, significantly enhancing authentication capabilities with federated credentials. This update simplifies the OAuth flow and improves security for Grafana instances leveraging Microsoft Azure, and was a valuable contribution from an external contributor. Thank you mehiglow.
Additional helpful documentation, links, and articles:
Video
Getting started with managing your metrics, logs, and traces using Grafana
In this webinar, we’ll demo how to get started using the LGTM Stack: Loki for logs, Grafana for visualization, Tempo for traces, and Mimir for metrics.
Video
Getting started with Grafana dashboard design
In this webinar, you'll learn how to design stylish and easily accessible Grafana dashboards that tell a story.
Video
Building advanced Grafana dashboards
In this webinar, we’ll demo how to build and format Grafana dashboards.